 Explicit Symbol Loading with dbghelp
When working with symbols, the default case is that you either analyze the current process, a concurrently running process or maybe even the kernel. dbghelp provides special support for these use cases and getting the right symbols to load is usually easy – having access to the process being analyzed, dbghelp can obtain the necessary module information by itself and will come up with the matching symbols.
Things are not quite as easy when analyzing symbols for a process (or kernel) that is not running any more or executes on a different machine. In this case, manual intervention is necessary – without your help, dbghelp will not be able to decide which PDB to load.
An example for a case where this applies is writing a binary tracefile. To keep the trace file small and to make writing entries as efficient as possible, it makes sense to write raw instruction pointer and function pointer addresses to the file. This way, resolving symbols and finding the names of the affected routines is delayed until the file is actually read.
However, when the trace file is read, the traced process (or kernel) may not be alive any more, so dbghelp’s automatisms cannot be used. Moreover, the version of the OS and the individual modules involved may not be the same on the machine where the trace is obtained and the machine where the trace file is read. It is thus crucial that the trace file contains all neccessary information required for the reading application to find and load the matching symbols.
Capturing the debug information
That sounds easy enough. But once again, the documentation on this topic is flaky enough to make this a non-trivial task. This thread on the OSR WinDBG list revealed some important insights, yet the summary is not entirely correct. So I will try to explain it here. Note that the discussion equally applies to user and kernel mode.
Two basic pieces of information need to be captured and stored in the trace file: The load address and the debug data of each module involved. The load address is required in order to later be able to convert from virtual addresses (VAs) to relative virtual addresses (RVAs). The debug data is neccessary for finding the PDB exactly matching the respective module.
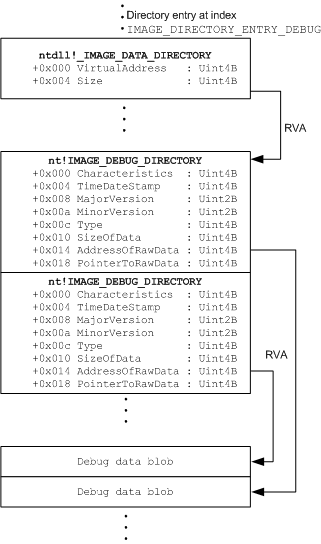
The debug data is stored in the PE image and can be obtained via the debug directory. The following diagram illustrates the basic layout of the affected parts of a PE image:

Via the _IMAGE_DATA_DIRECTORY structure, which is at index IMAGE_DIRECTORY_ENTRY_DEBUG of the DataDirectory, we can obtain the RVA of the debug directory – as always, RVAs are relative to the load address. The debug directory is a sequence of IMAGE_DEBUG_DIRECTORY structures. Although the CodeView entry should be the one of primary interest, expect more than one entry in this sequence. The entry count can be calculated by dividing _IMAGE_DATA_DIRECTORY::Size by sizeof( IMAGE_DEBUG_DIRECTORY ).
The IMAGE_DEBUG_DIRECTORY structures do not contain all necessary information by themselves – rather, they refer to a blob of debug data located elsewhere in the image. IMAGE_DEBUG_DIRECTORY::AddressOfRawData contains the RVA (again, relative to the load address) to this blob. Note that the blobs are not necessarily laid out in the same order as the corresponding IMAGE_DEBUG_DIRECTORY structures are. (The role of the PointerToRawData member in this context remains unclear.)
Summing up, we need to write to the trace file:
- The module load address
- all IMAGE_DEBUG_DIRECTORY entries
- all debug data blobs referred to
In order to maintain the relation between the IMAGE_DEBUG_DIRECTORY entries and their corresponding blobs, the AddressOfRawData and PointerToRawData members have to be updated before being written to the file. In order to make loading symbols a bit easier, it makes sense to save the entire sequence of IMAGE_DEBUG_DIRECTORY structs (with updated RVAs) contigously to the file, immediately followed by the debug data blobs.
Loading symbols
Having all neccessary information in the trace file, we can now load the symbols. The key is to use SymLoadModuleEx rather than SymLoadModule64 and passing it a MODLOAD_DATA struct:
- MODLOAD_DATA::data receives a pointer to the sequence of IMAGE_DEBUG_DIRECTORY structs. For each struct, the AddressOfRawData member should be set to 0 and PointerToRawData should receive the RVA of the corresponding debug data blob _relative to the beginning of the respective IMAGE_DEBUGDIRECTORY struct.
As indicated before, it therefore makes sense to write the IMAGE_DEBUG_DIRECTORY structs and the blobs consecutievly to the file and – at the time of writing – adjust the AddressOfRawData and PointerToRawData members. This way, you can just assign the entire memory chunk to MODLOAD_DATA::data.
- MODLOAD_DATA::size receives the size of the entire memory chunk, including both the sequence of IMAGE_DEBUG_DIRECTORY structs and all blobs.
There you go, dbghelp should now be able to identify the proper PDB and load the symbols.