 Tracking GitHub downloads using Google Sheets
If you use GitHub releases to host download packages, then you’re probably interested in how often these packages are being downloaded. You’d expect that the GitHub website provided that information under Insights > Traffic, but unfortunately, that’s not the case. Instead, you have to turn to the GitHub API.
To get information about download counts, you can query the
Releases resource, which is part of the GitHub API. This resource returns a list
of all your project’s releases, along with a list of assets for each release. For each asset, the JSON structure
contains a download_count field that indicates the number of times this particular asset has been downloaded:
[
  {
    "url": "https://api.github.com/...",
    ...
    "tag_name": "1.2.0",
    ...
    "assets": [
      {
        "url": "https://api.github.com/...",
        "name": "MyRelease.msi",
        ...
        "download_count": 704,
        "created_at": "2021-04-09T10:03:15Z",
        "updated_at": "2021-04-09T10:14:24Z",
        "browser_download_url": "https://github.com/.../1.2.0/MyRelease.msi"
      }
    ]
  }
]
While the total number of downloads is interesting, the value doesn’t tell you anything about how download counts have evolved over time: Are download counts stagnating? Are they increasing? Are there any interesting patterns?
To answer these questions, you need to sample the GitHub API periodically (once a day, probably) and create a time series of download counts.
There are a million ways to write a script that requests the download count from Github once a day and records it as a time series somewhere – but there’s probably no easier way to do it than with Google Sheets and a few lines of AppScript:
function recordStats() {
  var url = "https://api.github.com/repos/.../releases";


  var response = UrlFetchApp.fetch(url, {'muteHttpExceptions': true});
  var json = response.getContentText();
  var releases = JSON.parse(json);
  var msiDownloadsTotal = 0;

  var versionsSheet = SpreadsheetApp.getActive().getSheetByName("Versions");

  for (var i = 0; i < releases.length; i++)
  {
    for (var j = 0; j < releases[i].assets.length; j++)
    {
      if (releases[i].assets[j].browser_download_url.endsWith(".msi"))
      {
        msiDownloadsTotal += releases[i].assets[j].download_count;


        versionsSheet.appendRow([
          Utilities.formatDate(new Date(), "GMT", "yyyy-MM-dd"),
          releases[i].tag_name,
          releases[i].assets[j].download_count]);
      }
    }
  }

  var mainSheet = SpreadsheetApp.getActive().getSheetByName("Total");
  mainSheet.appendRow([Utilities.formatDate(new Date(), "GMT", "yyyy-MM-dd"), msiDownloadsTotal]);
}
What the script does is:
- Request the GitHub Releases resource
- Iterate over the releases and assets
- Append a line to the Versions sheet that indicates the total number of downloads per individual asset.
- Append a line to the Total sheet that indicates the total number of downloads across all assets.
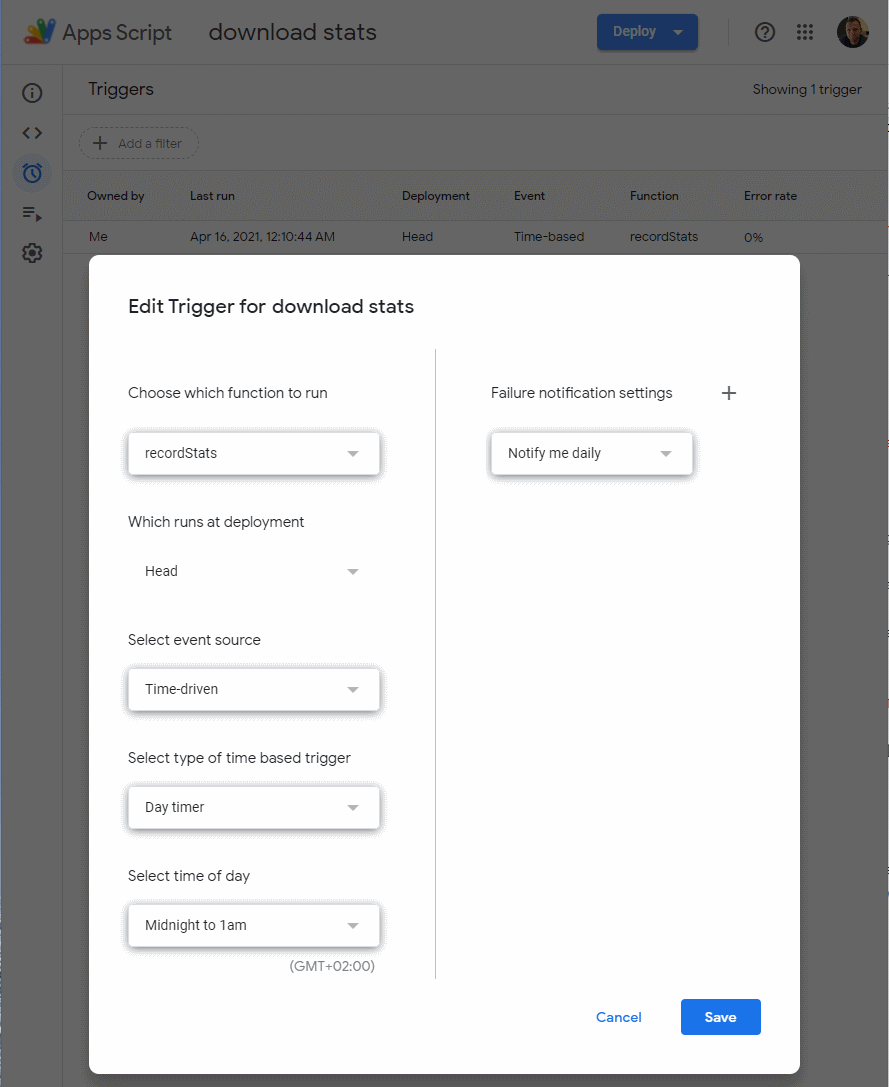
To make sure the script runs once a day, all you have to do is set up a trigger that invokes the recordStats function once a day:
In a truly serverless way, Google Sheets will now invoke the script once a day and every day, your sheet will grow:
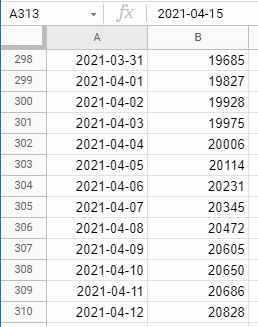
Once you have a few weeks worth of data, you’re all set to set up graphs and run your analysis.